
Running K8ssandra on VMware Tanzu Kubernetes Grid with VMware Cloud on AWS
Executive Summary
Deploying Apache Cassandra™ on Kubernetes directly alongside applications can be a significant driver of increased developer productivity and scalability at reduced cost.
This paper provides generic design and deployment guidelines for running K8ssandra on VMware Tanzu® Kubernetes Grid™ Service. We also validate the core function to demonstrate the K8ssandra operator enables Cassandra deployment into multiple clusters and provides unified deployment and management operations of Cassandra clusters on VMware Tanzu. In addition, we run performance testing to show running Cassandra in Kubernetes brings flexibility and ease of use with consistent throughput and low latency.
Technology Overview
The technological components in this solution are:
- VMware Cloud on AWS
- VMware vSAN
- VMware Cloud Flex Storage™
- VMware Tanzu Kubernetes Grid
- K8ssandra
VMware Cloud on AWS
VMware Cloud on AWS brings VMware’s enterprise class Software-Defined Data Center software to the AWS Cloud and enables customers to run production applications across VMware vSphere®-based private, public and hybrid cloud environments, with optimized access to AWS services. Jointly engineered by VMware and AWS, this on-demand service enables IT teams to seamlessly extend, migrate and manage their cloud-based resources with familiar VMware tools –minimizes the hassles of learning new skills or utilizing new tools. VMware Cloud on AWS integrates VMware’s flagship compute, storage, and network virtualization products (VMware vSphere, VMware vSAN and VMware NSX®) along with VMware vCenter® management as well as robust disaster protection, and optimizes it to run on dedicated, elastic, Amazon EC2 bare-metal infrastructure that is fully integrated as part of the AWS Cloud. This service is delivered and supported by VMware and its partner community. This service is sold by VMware, AWS, and their respective partner networks. With the same architecture and operational experience on-premises and in the cloud, IT teams can now quickly derive instant business value from use of the AWS and VMware hybrid cloud experience.
VMware vSAN
The default storage option available in VMware Cloud on AWS is vSAN. VMware Cloud on AWS provides two vSAN “logical” datastores in each SDDC cluster: “WorkloadDatastore” managed by the customer and “vsanDatastore” managed by VMware. These datastores are logical entities that share a common capacity pool. WorkloadDatastore provides storage for the application VMs. As we advance, vSAN datastore refers to the WorkloadDatastore. vSAN datastore storage capacity scales with the number of nodes in the SDDC. Data redundancy requirements are defined per VMware Cloud on AWS SLAs and are enforced by using Automated Storage Policy management. All RAID configurations consume data to support redundancy.
VMware Cloud Flex Storage
VMware Cloud Flex Storage is a scalable, elastic, and natively integrated storage service for VMware Cloud on AWS that is fully managed by VMware and delivered with predictable cloud economics. Customers can scale storage without adding hosts, simplify operations with a solution that is easy to purchase, use, and manage, and benefit from a straightforward pay-as-you-go consumption model.

Figure 1. VMware Cloud on AWS SDDC (Software Defined Datacenter) with VMware Cloud Flex Storage
VMware Tanzu Kubernetes Grid
VMware Tanzu Kubernetes Grid provides organizations with a consistent, upstream-compatible, regional Kubernetes substrate that is ready for end-user workloads and ecosystem integrations. You can deploy Tanzu Kubernetes Grid across software-defined datacenters (SDDC) and public cloud environments, including vSphere, Microsoft Azure, and Amazon EC2.
Tanzu Kubernetes Grid provides the services such as networking, authentication, ingress control, and logging that a production Kubernetes environment requires. It can simplify operations of large-scale, multi-cluster Kubernetes environments, and keep your workloads properly isolated. It also automates lifecycle management to reduce your risk and shift your focus to more strategic work.
This document describes the use of VMware Tanzu Kubernetes Grid service to support machine learning workloads that are distributed across the nodes and servers in the cluster.
K8ssandra
K8ssandra is a cloud-native distribution of Apache Cassandra® that runs on Kubernetes. K8ssandra provides an ecosystem of tools to provide richer data APIs and automated operations alongside Cassandra. This includes metrics monitoring to promote observability, data anti-entropy services to support reliability, and backup/restore tools to support high availability and disaster recovery.
As an open-source project licensed under Apache Software License version 2, K8ssandra is free to use, improve, and enjoy. K8ssandra integrates and packages together:
- Apache Cassandra
- Stargate, the open-source data gateway
- Cass-operator, the Kubernetes Operator for Apache Cassandra
- Reaper for Apache Cassandra, an anti-entropy repair feature (plus reaper-operator)
- Medusa for Apache Cassandra for backup and restore (plus medusa-operator)
- Metrics Collector for Apache Cassandra, with Prometheus integration, and visualization via pre-configured Grafana dashboards
See k8ssandra website for more information.
Solution Configuration
Architecture
Two Tanzu Kubernetes Clusters (TKC1 and TKC2) with routable network are provisioned each with multiple worker nodes. Persistent volumes are backed by vSAN. k8ssandra operators are installed in both TKC clusters, and k8sandra control plane is installed in TKC1, data plane is installed in TKC2 for multiple TKC clusters, Similarly, we can deploy with more building blocks equivalent to TKC2. We can deploy two-datacenter Cassandra cluster instance from control plane TKC 1.

Figure 2. Solution Architecture
K8ssandra is deployed in namespace k8ssandra-operator in the Tanzu Kubernetes Clusters and monitoring service Prometheus and Grafana are deployed in namespace monitoring.
Note: Our validation is based on one vSphere cluster: the multi-cluster Cassandra deployment is used for test and development purposes. The latest vSphere with Tanzu 8.0 introduces a new feature of deploying a Supervisor Cluster across vSphere Zones, which enables you to provision Tanzu Kubernetes clusters in specific availability zones and failure domains. This allows for workloads to span across multiple clusters, which increases the resiliency to hardware and software failures.
Hardware Resource
VMware Cloud on AWS supports the use of several popular AWS instances as SDDC hosts.
All hosts in a cluster must be of the same type. In our validation environment, we used the I3en instance (Intel Cascade Lake). This storage-optimized host type is best suited to workloads that require high capacity and high-performance storage. See the VMware Cloud Tech Zone article SDDC Host Types for details.
Software Resource
Table 1. Software Resource
|
Software |
Version |
|
SDDC |
1.20v2 |
|
Tanzu Kubernetes Release |
v1.23.8+vmware.1 |
|
K8ssandra |
K8ssandra-operator v1.2 |
|
Prometheus |
kube-prometheus realease-v0.9 |
Network Configuration
The Tanzu Kubernetes Cluster is configured with VMware NSX, which leverages the NSX load balancer to provide connectivity to external services to users. The Cassandra pods are placed in a namespace and the Stargate and Reaper services can also be configured as load balancer types for publishing the service. Similarly, the Grafana service can change to load balancer type to publish the service internally. See the Solution Validation section for examples.

Figure 3. Network
Monitoring Tools
Grafana Dashboard
Grafana is a tool commonly used to visualize Prometheus metrics, K8ssandra deployed instance with Metric Collector for Apache Cassandra (MCAC) which aggregates OS and Cassandra metrics along with diagnostic events in Prometheus format. Grafana dashboard is used for visualization of metrics associated with the Cassandra cluster.
vSAN Performance Service
The vSAN Performance Service is for monitoring the performance of the vSAN environment and helping users to investigate potential problems. The performance service collects and analyzes performance statistics and displays the data in a graphical format. You can use the performance charts to manage your workload and determine the root cause of problems.
Activating Tanzu Kubernetes Grid
Tanzu Kubernetes Grid is a managed service offered by VMware Cloud on AWS. Activate Tanzu Kubernetes Grid in one or more SDDC clusters to configure Tanzu support in the SDDC vCenter Server.
We followed the VMware Cloud on AWS product documentationto activate Tanzu Kubernetes Grid in an SDDC Cluster.
Provisioning the Tanzu Kubernetes Cluster
Our validation of multi-cluster k8ssandra deployment requires routable pods networking on Tanzu.
Note: In non-VMware Cloud on AWS deployments, routable pods networking requires the Supervisor cluster to be configured with VMware NSX.
We deployed two Tanzu Kubernetes clusters which follow Configuring a Tanzu Kubernetes Cluster with a Routable Pod Network Using the v1alpha2 API.
While provisioning the Tanzu Kubernetes Cluster, we defined the control planes and worker nodes as follows.
Table 2. Tanzu Kubernetes Cluster Definition
|
Role |
Replicas |
VM Class |
Tanzu Kubernetes Release (TKR) |
|
Control Plane |
3 |
best-effort-small |
v1.23.8---vmware.1-tkg.1 |
|
Worker Nodes |
4 |
best-effort-2xlarge |
v1.23.8---vmware.1-tkg.1 |
The YAML file we used in this example for Tanzu Kubernetes Cluster deployment can be found here.
Note: For enabling the workload, you need to assign a large namespace network CIDR, consider a span of /16 or /12 to provide adequate capacity for Tanzu Kubernetes Grid workloads in the cluster. For deploying Tanzu Kubernetes Cluster in production, make sure you have deployed a sufficient number of physical hosts to accommodate the placement of all the worker nodes without affecting failure scenarios.
K8ssandra Deployment
Introduction
K8ssandra Operator provides an entirely new, solidified set of features for Kubernetes + Cassandra deployments. Important enhancements include multi-cluster and multi-region support, which enables greater scalability and availability for enterprise apps and data. Single cluster/region deployments are also supported with K8ssandra Operator. We used the latest K8ssandra Operator v1.2 for our validation.
While K8ssandra Operator is designed for multi-cluster use, it can be used in a single Kubernetes cluster without any extra configuration. We validated both single-cluster deployment and multi-cluster deployment options using Kustomize.
Prerequisites
All prerequisites must be installed and configured before creating the Tanzu Kubernetes Cluster:
- Download and install kubectl for vSphere. In our validation, we used ubuntu 20.04.4 LTS client VM.
- Install Kustomize for K8ssandra installation.
- For multi-cluster deployment, Tanzu Kubernetes Cluster should follow Configuring a Tanzu Kubernetes Cluster with a Routable Pod Network Using the v1alpha2 API because pod IP addresses must be routable between all Kubernetes clusters.
- create-clientconfig.sh are used for remote Kubernetes cluster access configuration for multi cluster deployment option.
Deploying K8ssandra-operator
Deploying Single-cluster K8ssandra-operator
We perform the following steps to deploy K8ssandra-operator on a single Tanzu Kubernetes Cluster:
- The following kubectl command creates a ClusterRoleBinding that grants access to authenticated users to run a privileged set of workloads using the default PSP vmware-system-privileged:
kubectl create clusterrolebinding default-tkg-admin-privileged-binding --clusterrole=psp:vmware-system-privileged --group=system:authenticated
- Install cert-manager because it is a dependency of cass-operator:
kubectl apply -f https://github.com/jetstack/cert-manager/releases/download/v1.7.1/cert-manager.yaml
- Install k8sssandra-operator:
kustomize build "github.com/k8ssandra/k8ssandra-operator/config/deployments/control-plane?ref=v1.1.1" | k apply --server-side -f -
- Check that there are two deployments in the k8ssandra-operator namespace:
kubectl -n k8ssandra-operator get deployment
NAME READY UP-TO-DATE AVAILABLE AGE
cass-operator-controller-manager 1/1 1 1 2d
k8ssandra-operator 1/1 1 1 2d
Deploying Multi-cluster K8ssandra-operator
K8ssandra operator requires clusters to have routable pod IPs. In our validation, we deployed two Tanzu Kubernetes Clusters with the name cassandra-1 and cassandra-2. We plan to install the control plane on cassandra-1 and data plane on cassandra-2.
For control plane installation:
Log in the Cassandra-1 cluster and switch context to Cassandra-1.
Follow the same steps as single cluster deployment ones.
Verify the K8SSANDRA_CONTROL_PLANE environment variable is set to true.
kubectl -n k8ssandra-operator get deployment k8ssandra-operator -o jsonpath='{.spec.template.spec.containers[0]. env[?(@.name=="K8SSANDRA_CONTROL_PLANE")].value}'
For data plane installation:
- Install the k8ssandra-operator:
kustomize build "github.com/k8ssandra/k8ssandra-operator/config/deployments/data-plane?ref=v1.1.1" | k apply --server-side -f –
- Verify the deployment:
kubectl get deployment -n k8ssandra-operator
NAME READY UP-TO-DATE AVAILABLE AGE
cass-operator-controller-manager 1/1 1 1 24d
k8ssandra-operator 1/1 1 1 24d
- Verify the K8SSANDRA_CONTROL_PLANE environment variable is set to false:
kubectl -n k8ssandra-operator get deployment k8ssandra-operator -o jsonpath='{.spec.template.spec.containers[0]. env[?(@.name=="K8SSANDRA_CONTROL_PLANE")].value}'
Creating and Managing Connections to Remote Clusters
The K8ssandra operator uses Kubernetes APIs to manage objects in remote clusters; therefore, it needs to create client connections with appropriate permissions to remote clusters.
K8ssandra Operator uses a kubeconfig file to create a remote client connection. A service account provides authentication and authorization with the api server. The operator accesses the kubeconfig file via a secret.
A ClientConfig is a reference to a kubeconfig secret. At startup, the operator queries for all ClientConfigs in the namespace it is configured to watch. It iterates through the ClientConfigs and creates a remote client for each one.
Follow the instructions to create a ClientConfig using the scripts.
In our validation, we have two Tanzu Kubernetes Clusters: casssandra-1 and cassandra-2. The control plane is running in cassandra-1, we want to create a ClientConfig for Cassandra-1:
./create-clientconfig.sh --namespace k8ssandra-operator --src-kubeconfig ./.kube/config --dest-kubeconfig ./.kube/config --src-context cassandra-2 --dest-context cassandra-1 --output./clientconfig/
In /clientconfig folder, the Cassandra-2.yaml file is generated as below:
apiVersion: config.k8ssandra.io/v1beta1
kind: ClientConfig
metadata:
name: cassandra-2
spec:
contextName: cassandra-2
kubeConfigSecret:
name: cassandra-2-config
and in Cassandra-1, we can verify the secret is created:
kubectl describe secret cassandra-2-config -n k8ssandra-operator
Name: cassandra-2-config
Namespace: k8ssandra-operator
Labels: <none>
Annotations: <none>
Type: Opaque
Data
====
kubeconfig: 2763 bytes
Deploying K8ssandra Cluster
We will create a K8ssandraCluster custom resource that consists of a Cassandra cluster with 2 DCs and 3 nodes per DC, and a Stargate node per DC. Refer to the YAML file.
Note: In the YAML file, SoftPodAntiAffinity sets whether multiple Cassandra instances can be scheduled on the same node. This should normally be false to ensure cluster resilience but might be set to true for test/dev scenarios to minimize the number of nodes required.
In Cassandra-1 context: kubectl apply -f test2dc.yaml
After all pods in DC1 are ready, it will deploy pods in DC2.
And in Cassandra-1 context, verify pods in dc1 are running:
kubectl get pod -n k8ssandra-operator
NAME READY STATUS RESTARTS AGE
cass-operator-controller-manager-bc74cf55f-4sg4c 1/1 Running 49 21d
demo-dc1-default-stargate-deployment-59f48db47f-bw77w 1/1 Running 0 20d
demo-dc1-default-sts-0 2/2 Running 0 20d
demo-dc1-default-sts-1 2/2 Running 0 20d
demo-dc1-default-sts-2 2/2 Running 0 20d
k8ssandra-operator-7f95dcbd99-h6h99 1/1 Running 2 21d
Switch to Cassandra-2 context and verify pods in dc2 are running:
kubectl get pod -n k8ssandra-operator
NAME READY STATUS RESTARTS AGE
cass-operator-controller-manager-bc74cf55f-gz4zw 1/1 Running 10 24d
demo-dc2-default-stargate-deployment-577447ff87-rjb65 1/1 Running 0 20d
demo-dc2-default-sts-0 2/2 Running 0 20d
demo-dc2-default-sts-1 2/2 Running 0 20d
demo-dc2-default-sts-2 2/2 Running 0 20d
k8ssandra-operator-66f7cd676b-9sqkm 1/1 Running 0 24d
For more information, refer to Install K8ssandra Operator.
Solution Validation
K8ssandra Operator is a native Kubernetes operator that supports the deployment and management of Cassandra databases. It also includes a suite of tools to ease and automate operational tasks.
Besides deploying Cassandra into multi-cluster Kubernetes environments, we validated the core functions for workload testing and verified integration Prometheus and Grafana for visualization of metrics associated with the Cassandra cluster metrics from monitoring dashboard, we also verified the operation for Cassandra repair using Reaper.
- Cluster access
- Prometheus Grafana Integration
- Workload testing
- Reaper for Cassandra repair
Cluster Access
K8ssandra enables authentication and authorization by default. With authentication enabled, K8ssandra configures a new, default superuser. The username defaults to {metadata.name}-superuser
Credentials are stored in a secret named {metadata.name}- superuser.
Use the following command to get the Cassandra cluster credential for future connections.
In our example, we deployed a cluster with name demo, (replace demo with the name configured for your running cluster)
Extract and decode the username secret:
kubectl get secret demo-superuser -o jsonpath="{.data.username}" -n k8ssandra-operator | base64 --decode
Extract and decode the password secret:
kubectl get secret demo-superuser -o jsonpath="{.data.password}" -n k8ssandra-operator | base64 --decode
Stargate has no specific credentials. It uses the same superuser as defined for Cassandra.
We can get the startgate service for Cassandra data access:
kubectl get svc -n k8ssandra-operator
NAME TYPE CLUSTER-IP EXTERNAL-IP PORT(S) AGE
cass-operator-webhook-service ClusterIP 198.63.148.139 <none> 443/T 50d
demo-dc1-additional-seed-service ClusterIP None <none> <none> 4d
demo-dc1-all-pods-service ClusterIP None <none> 9042/TCP,8080/TCP,9103/TCP 4d
demo-dc1-reaper-service ClusterIP 198.62.69.68 <none> 8080/TCP 4d
demo-dc1-service ClusterIP None <none> 9042/TCP,9142/TCP,8080/TCP,9103/TCP,9160/ 4d
demo-dc1-stargate-service ClusterIP 198.51.206.94 <none>8080/TCP,8081/TCP,8082/TCP,8084/TCP,8085/TCP,9042/TCP 4d
demo-seed-service ClusterIP None <none> <none> 4d
k8ssandra-operator-webhook-service ClusterIP 198.50.29.199 <none> 443/TCP 50d
prometheus-operated ClusterIP None <none> 9090/TCP 35d
We changed the demo-dc1-stargate-service to load balancer type:
kubectl -n k8ssandra-operator patch service demo-dc1-stargate-service -p '{"spec": {"type":"LoadBalancer"}}'
kubectl get svc -n k8ssandra-operator
NAME TYPE CLUSTER-IP EXTERNAL-IP PORT(S) AGE
cass-operator-webhook-service ClusterIP 198.63.148.139 <none> 443/TCP 50d
...
demo-dc1-stargate-service LoadBalancer 198.51.206.94 192.168.10.6 8080:31713/TCP,8081:30508/TCP,8082:31096/TCP,8084:32473/TCP,8085:30762/TCP,9042:30339/TCP 5d
We can use 192.168.10.6 for stargate service access. Follow the instructions Enable Internet access to Kubernetes Service if public access is needed.
Prometheus Grafana Integration
k8ssandra-operator does not deploy kube-prometheus. You need to do it separately. Prometheus scrapes metrics from Metric Collector for Apache Cassandra (MCAC) agent on Cassandra nodes, which aggregates OS and C* metrics along with diagnostic events to facilitate problem resolution and remediation. Grafana is a tool commonly used to visualize Prometheus metrics.
This section provides instructions for integrating kube-promethues with k8ssandra on Tanzu Kubernetes Cluster.
Metric Collector for Apache Cassandra
Metric Collector for Apache Cassandra (MCAC) aggregates OS and C* metrics along with diagnostic events to facilitate problem resolution and remediation. It supports existing Apache Cassandra clusters and is a self-contained drop in agent.
Metrics Collector for Apache Cassandra (MCAC) is the key to providing useful metrics for K8ssandra users. MCAC is deployed to your Kubernetes environment by K8ssandra.
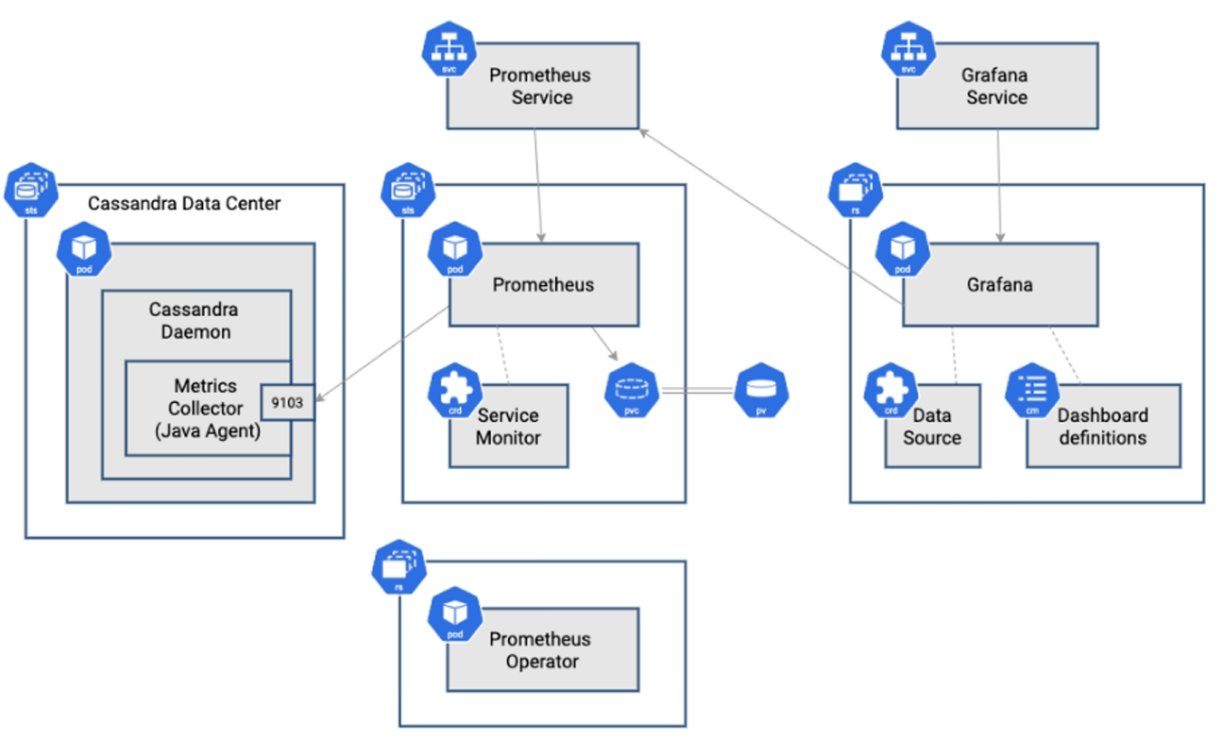
Figure 4. Metric Collector
As shown in the figure, the Metrics Collector is configured to expose metrics on the standard Prometheus port (9103).
Grafana DataSource is used to describe how to connect to the Prometheus service.
Deploying Prometheus
We used the manifests for installation, perform the following steps to deploy Kube-Prometheus on your Tanzu Kubernetes Cluster:
- The following kubectl command creates a ClusterRoleBinding that grants access to authenticated users to run a privileged set of workloads using the default PSP vmware-system-privileged.
kubectl create clusterrolebinding default-tkg-admin-privileged-binding --clusterrole=psp:vmware-system-privileged --group=system:authenticated
- Download the scripts to deploy kube-prometheus by cloning the GitHub repository:
According to the compatibility list, we choose release-0.9 since our Tanzu Kubernetes version is v1.21.
https://github.com/prometheus-operator/kube-prometheus/tree/release-0.9
kubectl apply --server-side -f manifests/setup
kubectl wait \
--for condition=Established \
--all CustomResourceDefinition \
--namespace=monitoring
kubectl apply -f manifests
- Verify all the pods are running.
To check that all Kube-prometheus -related pods are ready, use the following commands to show the pods deployed in the monitoring namespace:

Figure 5. Pods in Monitoring Namespace
Configuring Prometheus
Follow the instructions here to configure the Prometheus operator and Grafana.
We should add the following RBAC (Role Based Access Control) permissions to the ClusterRole prometheus-k8s using Prometheus-k8s.yaml.
We need to integrate Cassandra metrics monitoring using the instance_monitoring.yaml file
kubectl apply -f instance_monitoring.yaml
Using Prometheus
To verify the Prometheus scraping function properly, we need to forward the service and browse at http://localhost:10000
kubectl port-forward -n monitoring services/prometheus-k8s 10000:9090
Searching for collectd, MCAC, or stargate in the Prometheus metrics search box will help you to find the metrics you are after.
Below is the screenshot for a MCAC metric.

Figure 6. Prometheus Monitoring Screenshot
Using Grafana
MCAC provides a set of dashboards designed to surface the most critical Cassandra metrics.
- We should forward the Grafana service:
kubectl port-forward -n monitoring services/grafana 10000:3000

Figure 7. Grafana Login
Use the default user admin/admin to log in via http://localhost:10000.
If you want to access externally, you need to change the service type to load balancer:
kubectl -n monitoring patch service grafana -p '{"spec": {"type": "LoadBalancer"}}'
service/grafana patched
+ icon on the left panel of the Grafana dashboard: an option comes up to import a dashboard.

Figure 8. Imported Grafana Dashboard
- Verify the Prometheus DataSource.

Figure 9. Prometheus DataSource
- Verify the Cassandra Cluster Dashboard.
Click on the imported dashboard, it displays the monitored Cassandra cluster metrics:

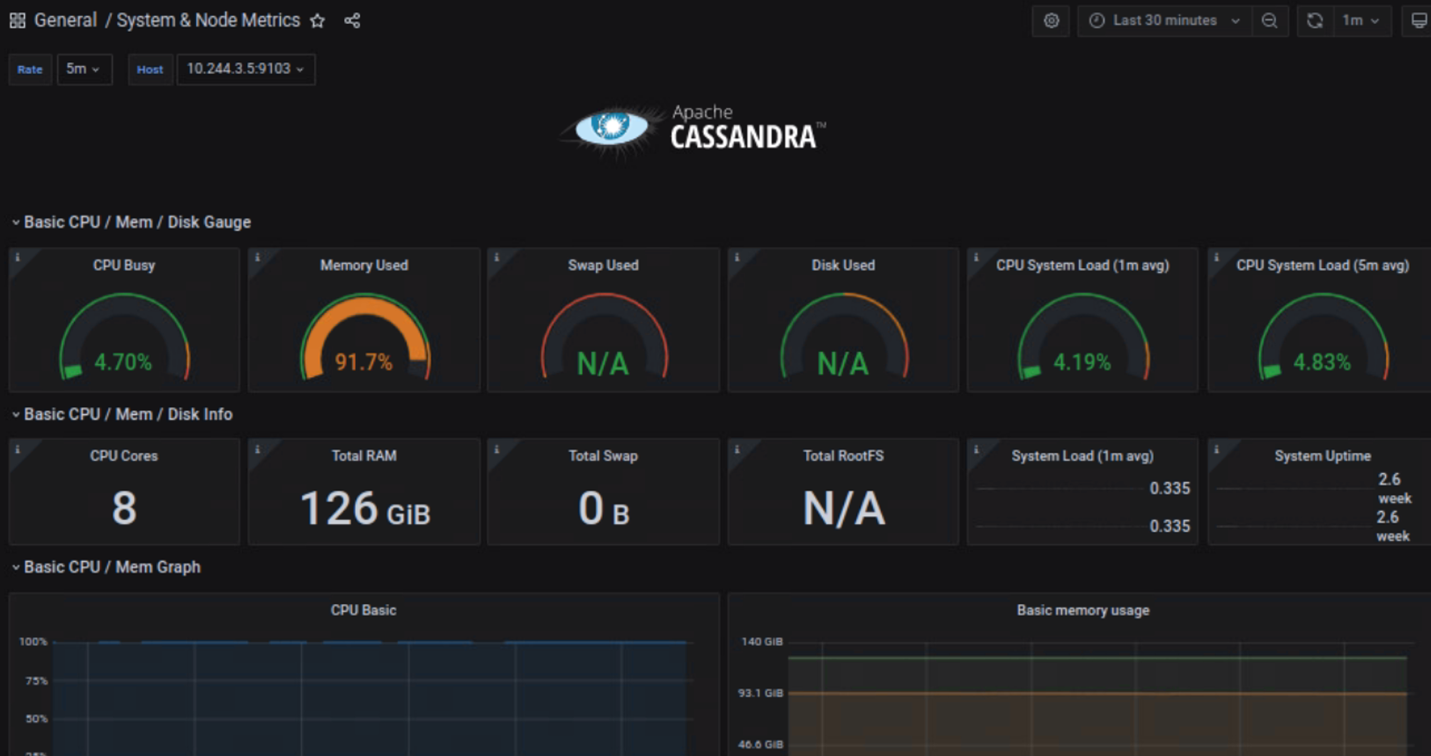
Figure 10. Cassandra Cluster Dashboard
For more information, refer to https://docs.k8ssandra.io/tasks/monitor/prometheus-grafana/.
Workload Testing
We ran workload tests using nosqlbench, DataStax’s sponsored open-source benchmarking suite.
We did some baseline performance testing to validate the cluster functions as expected for typical workloads for performance consistency and predictable latency.
Also, we did additional testing with various backend storage.
Note: The username/password is from the cluster access session.
According to the k8ssandra benchmark testing guidelines, we deployed our Cassandra cluster.
Cassandra Version and Settings
The recommendation for running Cassandra in production is to have the following specifications:
- 8 to 16 vCPUs
- 32 GB to 128 GB RAM
- 2 to 4 TB of disk space
- 5k to 10k IOPS (Input Output Per Second)
So, we chose the Cassandra node with resource:
- 8 vCPUs
- 64 GB RAM
- 2TB data disk
Note: We should configure TKC worker nodes’ VM Class no less than Cassandra Node, in our validation, we used the best-effort-2xlarger VM Class.
We chose Cassandra v4.0. 3 for workload testing.
Cassandra’s default settings were applied except for garbage collection (GC) settings. This used G1GC with 31GB of heap size, along with a few GC related JVM flags:
- -XX: +UseG1GC
- -XX: G1RSetUpdatingPauseTimePercent=5
- -XX:MaxGCPauseMillis=300
- -XX:InitiatingHeapOccupancyPercent=70 -Xms31G -Xmx31G
See our test cluster YAML file here.
kubectl apply -f k8ssandratestclusterperf.yaml
Throughput Test
Workload Test Scenario 1:
The cql-tabular2 workload is a NoSQLBench built-in workload that is designed to simulate the load generated by a tabular application. The workload creates a table called baselines.tabular2 with a column for the integer key, a column for the string value, and a column for the double value. The workload then generates random data points and inserts them into the table. The data points are evenly distributed across the different rows.
We used the cql-tabular2 profile that allowed us to stress the disks significantly. We used a replication factor of 3 with a 50/50 write/read workload, and this profile performs all statements at consistency level LOCAL_QUORUM.
Nosqlbench jobs definition can be found here.
Note: storageClassName: vmc-workload-storage-policy-cluster-1# the cluster is deployed on vSAN OSA storage.
vmc-fs # the cluster is deployed on VMware Cloud Flex Storage.
vsan-default-policy-raid5 # the cluster is deployed on vSAN RAID 5 storage.
kubectl create -f througputtest.yaml
We tested with difference stargate heap size, we chose 12G, 16G, 20G, and 24G on vSAN OSA.
We can get the job duration from job information as below:
kubectl get jobs -n k8ssandra-operator
NAME COMPLETIONS DURATION AGE
nosqlbenchsixteenheap 1/1 83m 10d
nosqlbenchlargestargateheap 1/1 90m 10d
nosqlbenchtwelvestargateheap 1/1 96m 22h
nosqlbenchtwentystargateheap 1/1 83m 9d
Grafana dashboards display cluster metrics such as request throughput IOPS/latencies and compaction statistics. 

Figure 11. Grafana Dashboard for Throughput Test
From test results, the 20G stargate heap size configuration got the largest throughput.
So, we used the same configuration for Cassandra cluster with VMware Cloud Flex Storage and vSAN RAID 5 storage.
Table 3. cql-tabular2 Workload Test Results on VMware Cloud Flex Storage and vSAN RAID 5 Storage
|
Throughput |
P50 Latency (ms) |
P99 Latency (ms) |
P999 Latency (ms) |
||
|
CloudFlex storage |
24,378 |
2.173451 |
8.270167 |
432.17313 |
|
|
vSAN RAID 5 |
23,534 |
2.241297 |
8.660780 |
441.986826 |
|
Workload Test Scenario 2:
The cql-iot workload is a NoSQLBench built-in workload that is designed to simulate the load generated by an IoT application. The workload creates a table called baselines.iot with a column for the timestamp of the data point, a column for the device ID, and a column for the sensor data. The workload then generates random data points and inserts them into the table. The data points are evenly distributed across the different devices.
The cql-iot workload can be used to benchmark the performance of Cassandra under a load that is representative of an IoT application.
We used the cql-iot profile, replication factor of 3 with a 90/10 write/read workload, and this profile performs all statements at consistency level LOCAL_QUORUM.
cql-iot
- rampup-cycles=1M
- main-cycles=100M
- write_ratio=9
- read_ratio=1
Table 4. cql-iot Workload Test Results on VMware Cloud Flex Storage and vSAN RAID 5 Storage
|
Throughput |
P50 Latency (ms) |
P99 Latency (ms) |
P999 Latency (ms) |
||
|
CloudFlex storage |
22,858 |
1.94949 |
6.833561 |
603.148645 |
|
|
vSAN RAID 5 |
23,020 |
1.914228 |
6.866415 |
613.562324 |
|
From the test results, the throughput and latency values on VMware Cloud Flex Storage and vSAN RAID 5 were very close.
Latency Test
The latency job definition we used is here.
kubectl create -f latencytest.yaml
Note that the latency test uses a striderate instead of a cyclerate. A striderate of 10 with a stride value of 800 would generate 8,000 cycles (operations) per second.
The job duration was 106 minutes (about 2 hours).
kubectl get jobs -n k8ssandra-operator
NAME COMPLETIONS DURATION AGE
nosqlbenchlatency 1/1 106m 11h
The latency metrics were collected from test result csv files in the mounted PV (Persistent Volumes).
The average throughput was 20,600. And the latency results were displayed in the figure below.

Figure 12. Latency Results
Grafana dashboards display the cluster metrics, the write latencies were lower than those of the throughput testing.


Figure 13. Grafana Dashboards for Latency Testing
Reaper for Cassandra Repairs
Reaper is an open-source tool to schedule and orchestrate repairs of Apache Cassandra clusters.
K8ssandra Operator deploys Reaper for Apache Cassandra to enable anti-entropy repair operations on Apache Cassandra data to handle the scheduling, execution, and monitoring of repair tasks. It is recommended to run a complete repair cycle across the entire dataset once every ten days.
We validated the operator of Cassandra node repair and snapshot.
Reaper Enablement
In our validation, we used the YAML file for the Cassandra cluster deployment to enable Reaper.
kubectl get pod -n k8ssandra-operator
NAME READY STATUS RESTARTS AGE
pod/cass-operator-controller-manager-bc74cf55f-4sg4c 1/1 Running 85 34d
pod/demo-dc1-default-stargate-deployment-6b98cc978c-5nxgc 1/1 Running 0 21h
pod/demo-dc1-default-sts-0 2/2 Running 0 21m
pod/demo-dc1-default-sts-1 2/2 Running 0 23m
pod/demo-dc1-default-sts-2 2/2 Running 0 24m
pod/demo-dc1-reaper-c7997ccf-w9gzz 1/1 Running 0 21h pod/k8ssandra-operator-7f95dcbd99-h6h99 1/1 Running 2 34d
Get the reaper service name:
kubectl get service -n k8ssandra-operator
NAME TYPE CLUSTER-IP EXTERNAL-IP PORT(S) AGE
cass-operator-webhook-service ClusterIP 198.63.148.139 <none> 443/TCP 36d
demo-dc1-additional-seed-service ClusterIP None <none> <none> 21h
demo-dc1-all-pods-service ClusterIP None <none> 9042/TCP,8080/TCP,9103/TCP 21h
demo-dc1-reaper-service ClusterIP 198.62.69.68 <none> 8080/TCP 22m
demo-dc1-service ClusterIP None <none> 9042/TCP,9142/TCP,8080/TCP,9103/TCP,9160/TCP 21h
demo-dc1-stargate-service ClusterIP 198.51.206.94 <none> 8080/TCP,8081/TCP,8082/TCP,8084/TCP,8085/TCP,9042/TCP 21h
demo-seed-service ClusterIP None <none> <none> 21h
k8ssandra-operator-webhook-service ClusterIP 198.50.29.199 <none> 443/TCP 36
Reaper Access
Perform the following steps to access Reaper web interface:
In our example, we deployed a cluster with name demo, (replace demo with the name configured for your running cluster).
- Use the following commands to get the Reaper UI credentials:
kubectl get secret demo-reaper-ui -n k8ssandra-operator -o json | jq -r '.data.username' | base64 –decode
kubectl get secret demo-reaper-ui -n k8ssandra-operator -o json | jq -r '.data.password' | base64 –decode
- Use port forwarding to provide external access to Reaper service:
kubectl port-forward service/demo-dc1-reaper-service 8080:8080 -n k8ssandra-operator
- Access Reaper Web interface through http://localhost:8080/webui using credential got in step 1.

In the Cluster tab, it shows the cluster information with Reaper service enabled, and we can click on the nodes
of the cluster to see detailed information.

Repair Operation
In the Schedules tab, add a new schedule to schedule a repair operation.
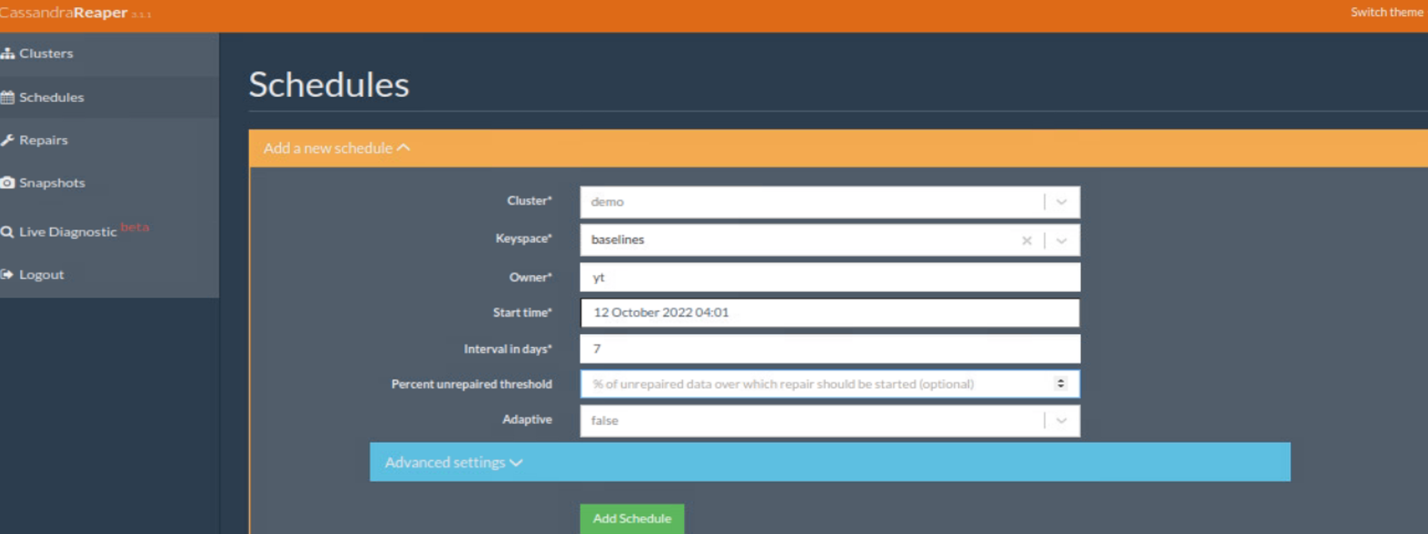
And the newly created schedule is demonstrated below.

When the repair job is running, in the repair tab, the information of the repair job is displayed as follows.
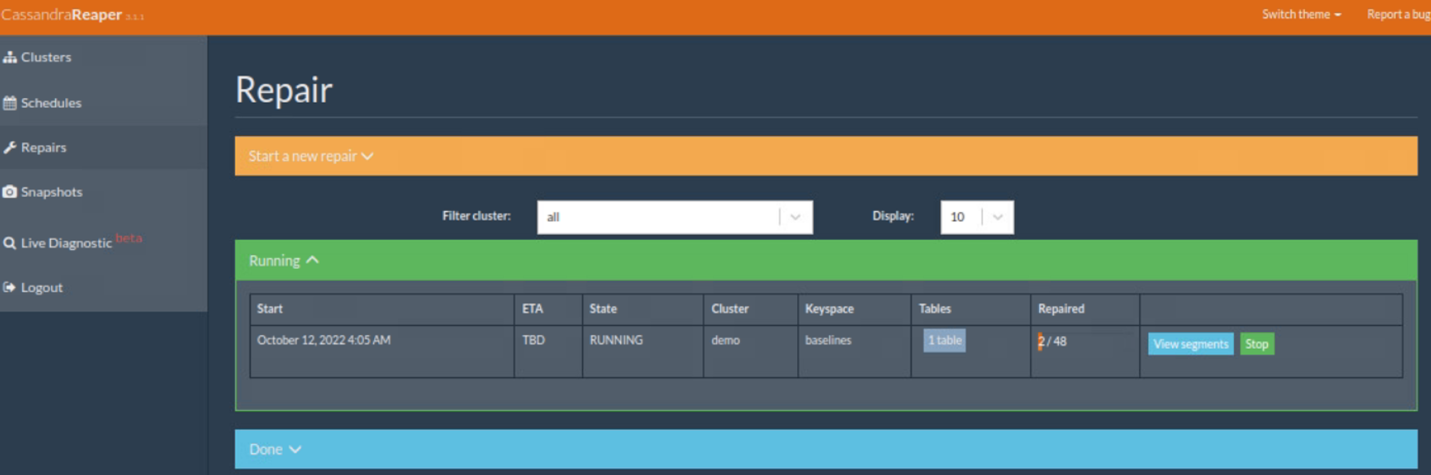
When the repair job is finished, it is shown in the Done list.

Snapshot Operation
In the Snapshot Tab, we can take snapshot of a keyspace of the cluster.

For more details, see Reaper for Apache Cassandra documentation.
Best Practices
- For deploying multiple Tanzu Kubernetes Clusters, it is recommended to reserve a large Namespace Network CIDR for future worker nodes scaleup. Plan the Tanzu Kubernetes Cluster class according to the desired Cassandra pod size.
- For K8ssandra cluster deployment, the stargate heap size should match the Cassandra pod, the proper size can be tuned through throughput or latency workload testing.
- For workload testing, it is recommended to have the container mount a persistent volume for the nosqlbench log files for later analysis of the log date stored in the PV after the job finishes.
- For Cassandra cluster deployment, start from a small number of nodes to tune the parameters and scaleup.
Conclusion
Overall, deploying, running, and managing k8ssandra on VMware Tanzu on VMware Cloud on AWS provides predictable performance and high availability. This platform allows IT administrators to enable fast cloud deployment, achieve better scalability for performance, ensure infrastructure and application security, monitor data center operational health, and lower TCO expenditure.
Reference
For more information, you can explore the following resources:
About the Author
Ting Yin, Senior Technical Marketing Architect in the Workload Technical Marketing Team of the Cloud Infrastructure Big Group, wrote the original version of this paper.
The following reviewers also contributed to the paper contents:
- Chen Wei, Director in the Workload Technical Marketing Team in VMware
- Christian Rauber, Staff Technical Marketing Architect in the Workload Technical Marketing Team in VMware
- Catherine Xu, Senior Manager in the Workload Technical Marketing Team in VMware
- Dharmesh Bhatt, Senior Solutions Architect in the VMC Product Management Team in VMware
- Sharath BN, Product Solutions Architect in the VMC Product Management Team in VMware
- Oleg Ulyanov, Staff Cloud Solutions Architect in the VMC Product Marketing Management Team in VMware
- Jyothi Srinath, Senior Staff Content Manager in VMware