
Feature Brief: Elastic DRS
Introduction
One of the great things about the VMware Cloud on AWS service is that it’s operated and managed by VMware, taking the infrastructure operations burden away from the customer. VMware does this by managing not only the SDDC lifecycle and remediation but also certain aspects of the vSphere environment such as Availability and DRS. One feature that further extends the availability and resiliency of the SDDC cluster, which is exclusive to VMware Cloud on AWS, is Elastic DRS (EDRS).
Elastic DRS is always enabled for all clusters in your SDDC and is set by default to monitor critical consumption of the default vSAN datastore. You also can adjust the effective EDRS policy if needed. As a customer, it’s critical to understand the configuration, intended scenarios, and behavior of EDRS in a different situation to control the cost of your SDDC.
How it Works
Elastic DRS allows you to scale your cluster in response to demand, or lack of demand, by adding or removing hosts automatically based on specific policies that are configured. The EDRS algorithm runs every 5 minutes and looks at predefined resource thresholds for CPU, memory, and storage. The thresholds cannot be changed by the user and differ based on the policy configured. While the algorithm runs every 5 minutes, the scaling decisions also take into account trends that are tracked over time. If ANY of the resources consistently remain above the defined threshold, a scale-up recommendation alert is generated, and a host is added to the cluster. Conversely, a scale-down recommendation alert is only generated when ALL resources are consistently below the threshold, triggering the removal of a host.
The following demo shows EDRS in action:
Policies
By default, the Elastic DRS baseline policy is configured for every cluster deployed within your SDDC. The policy monitors storage consumption only. The maximum usable capacity of your vSAN datastore is 80%; when you are about to reach that threshold, EDRS will automatically start the process of adding a host to your cluster and expanding your vSAN datastore. Please note that even if you free up enough storage to fall below the threshold, the cluster will not scale-down automatically. You will need to manually remove host(s) from the cluster.
Other consumption-based policies available include Optimize for Best Performance and Optimize for Lowest Cost. In these scenarios, the EDRS algorithm will look at the minimum and maximum hosts you’ve specified for your cluster size and take that into consideration with resource consumption. Optimizing for performance adds hosts quickly and removes them slowly to ensure the best possible performance; while optimizing for lowest cost removes hosts quickly and adds hosts slower to keep costs to a minimum.
Rapid Scale-Out is configured to react faster and to add hosts in parallel to allow a cluster to scale-out more quickly during an event. You can configure the scale-up increment, defining how many hosts are added in parallel, by selecting the Scale up increment setting and choosing from 4, 8, and 12 hosts. Some primary use cases that can benefit from this new policy are disaster recovery events, significant VDI power-on events, or even bulk workload migration/power-on events. The Rapid Scale-Out maximum resources thresholds are the same as the EDRS Performance Policy thresholds, but the minimum thresholds are set to 0%. This allows for a scale-out task to kick off quicker but also means we will not automatically scale-in; scale-in will be a manual process driven by the customer.
The resource thresholds differ based on the policy you configure.
|
EDRS Policy |
CPU Thresholds |
Memory Thresholds |
Storage Thresholds |
|
Rapid Scale-Out |
High: 80%, Low: 0% |
High: 80%, Low: 0% |
High: 80%, Low: 0% |
|
Best Performance |
High: 90%, Low: 50% |
High: 80%, Low: 50% |
High: 80%, Low: 20% |
|
Lower Cost |
High: 90%, Low: 60% |
High: 80%, Low: 60% |
High: 80%, Low: 20% |
|
Baseline (Storage Only) |
N/A |
N/A |
High: 80%, Low: 0% |
Starting May 2023, a new Elasticity tab is introduced to create a better overview of EDRS policies configured per cluster. It also includes options for custom EDRS policies.
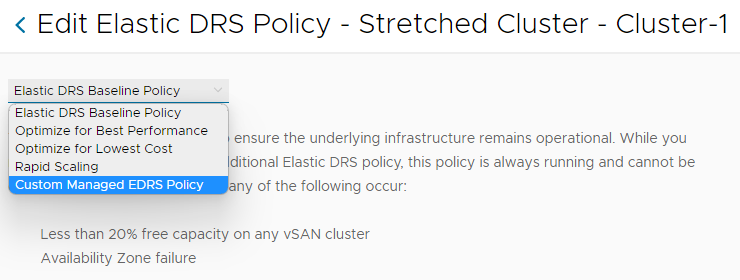
With the latest Cloud Console updates, customers will have even more flexibility with scalability configurations. A new 'Elasticity' tab is in the top menu making it easier to configure EDRS policies, including a new custom policy option! Check out this page for more technical information!
Enabling the Policy
To set the policy of your choice, edit the EDRS settings of your cluster, choose the new policy, and save the policy. The updated EDRS policy will be active immediately.

Safety Checks and Notifications
There is a safety check built-in, so we aren’t continuously adding or removing hosts; we want the cluster to “cool off” and the resources to level out. There is a 30-minute delay between scale-up events, and a 3-hour delay to trigger a scale-down event after a scale-up event.
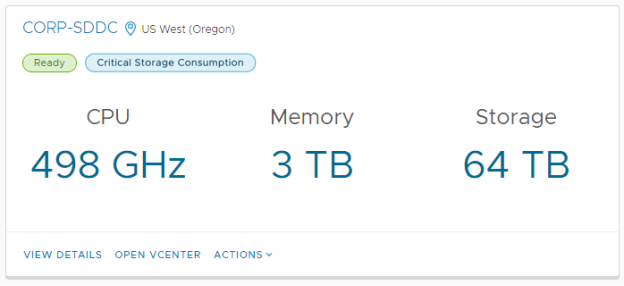
We aim to maintain the right balance between cost and accessibility of your environment. We implemented a proactive way to inform you that we might need to add a host to a vSphere cluster in your SDDC. We send EDRS storage scale-out warning notifications (via email and the VMC console) to the customer when the vSAN storage consumption on the vSphere cluster in your SDDC reaches critical thresholds between 70% and 76%. It gives you time to react proactively and decrease the storage consumption (for example, by removing unneeded snapshots, powered off VMs, or moving your VMs to another vSphere cluster/SDDC.)
If your cluster reaches the threshold and scaling recommendations are generated by EDRS, the multi-channel notification service will send out automated notifications via email to organization members.
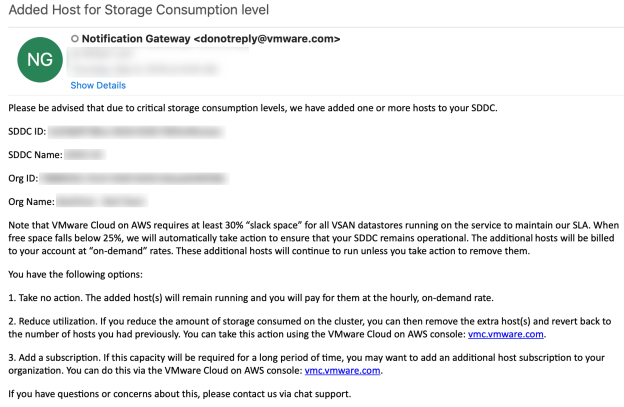
And via the console:
![]()
Information is also tracked in the Activity Log:

Lastly, more detailed tasks are tracked within the web client:

As you can see, there’s certainly no shortage of notifications when it comes to scaling your clusters. Customers can also subscribe to the notification webhook for the events.
In the end, you have the scalability and flexibility you expect from a Cloud service to maintain availability, capacity, and performance.
Cross Cluster eDRS
EDRS helps with the optimum utilization of resources. However, the boundary for DRS is the cluster construct. Customers have multiple clusters for their business segregations, and cloud computing resources are shared within these clusters. The Cross Cluster EDRS capability helps customers to understand what clusters in their SDDCs can be scaled in if there are clusters that are 'under-utilized'. By doing so, customers achieve the most optimal use of resources within their subscriptions.
Whenever EDRS recommends a scale-out for a specific cluster, depending on the EDRS policy, EDRS will proactively check cluster utilization for all clusters in a customer org. When it sees a cluster under-utilized, EDRS will send a notification by e-mail with the recommendation to scale in that specific cluster.
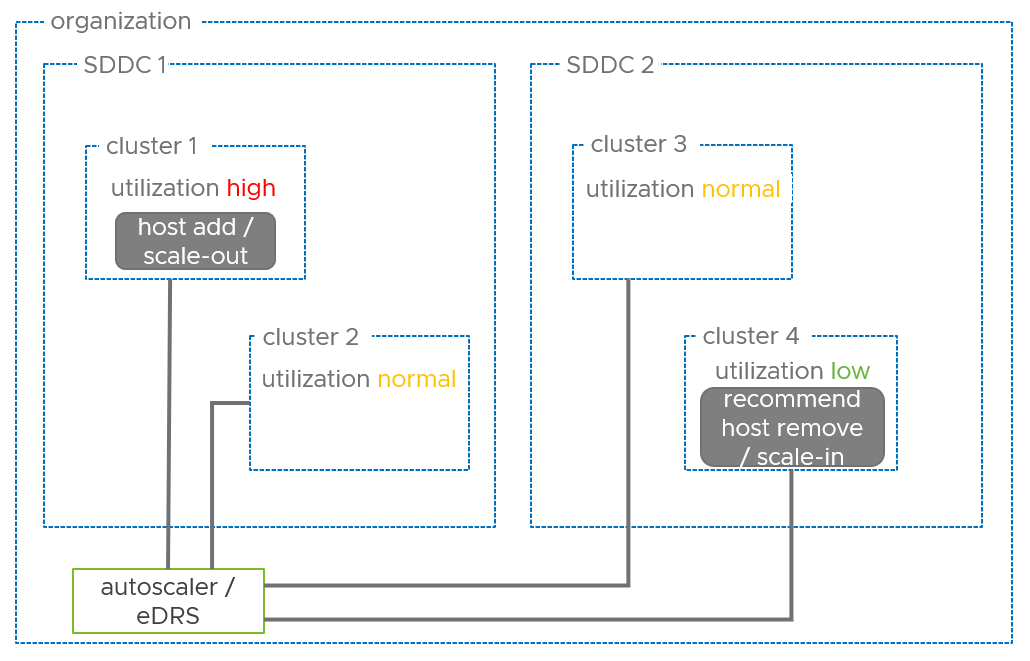
The workflow for cross-cluster EDRS recommendations is as follows:
- Find all the clusters in the organization.
- Retrieve resource utilization values for all clusters in all SDDCs.
- Filter out the clusters with scale in thresholds below CPU=65%, Memory=65%
- If candidate clusters are found, notify the customer about underutilized capacity in the candidate cluster.
- If no cluster is found with the agreed scale-in threshold values, find the cluster with the least corresponding resource utilization values and at least 4 hosts.
- Check if a potential host removal from that cluster would violate vSAN slack space requirements. If not, select the cluster as a candidate and notify the customer about underutilization.
- If vSAN slack space requirements are violated, the workflow concludes that there is no candidate cluster for resource optimization.

The recommendation by e-mail would look similar to this example. Remember, today the cross-cluster EDRS capability is recommended only. Customers still need to manually remove a host from an under-utilized cluster. The goal here is to make sure all clusters and hosts are utilized in the most efficient way. Therefore we encourage customers to review the EDRS policies in the Cloud Console as using the correct policy for your environment results in potential cost savings.