Dashboards & Log Analysis for VMware Cloud DR
Summary
VMware Cloud Disaster Recovery customers can use VMware Aria Operations for Logs to visualise activity via custom dashboards, identify root cause issues more quickly and forward on event data to SIEM systems.
This article shows how setting up data feeds is a 5 minute task and then alerts, external feeds and dashboards can quickly and easily be created (or use the example in this article as your starting point).
Introduction
VMware Aria Operations for Logs (formerly known as vRealize Log Insight Cloud) provides intuitive visualization and intelligent querying into your VMware SDDC, VMware Cloud Services, and multi-clouds that provides actionable solutions when issues are detected with faster root cause analysis. VMware Aria Operations for Logs is now able to ingest, visualise and forward VMware Cloud DR logs and events to provide visualisation, insight & also forward VMware Cloud DR telemetry to Security Information & Event Management (SIEM) systems for analysis and aggregation.
VMware Cloud DR can easily be configured to forward event data to VMware Aria Operations for Logs & the modest traffic volumes from VMware Cloud DR is either a small addition to existing usage or can be accommodated within the free tier of service offered by VMware.
This article illustrates how to setup these two solutions & provides example dashboards and alerts within VMware Aria Operations for Logs for a fast start to realising value from this integration.
Activating event data feeds from VMware Cloud DR
The steps to activate event data feeds from VMware Cloud DR are as follows:
1 – In your Cloud Services Portal account add vRealize Log Insight Cloud as a service if not already using in the VMware Cloud org you want to receive the event data into, launch the service, click setup log source & use free trial or free tier*.![]()
![]()

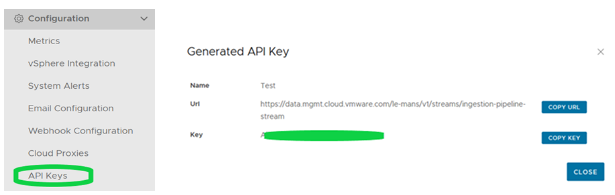
2 - In the Aria Operations for Logs UI, from the left navigation click Configuration > API Keys. Click New API Key, enter a unique name identifier (no spaces allowed) & click Create. Copy the URL and key for use in step 3. ![]()
![]()
3 - Switch to the VCDR instance & region you want to forward event data for (this can be in a different org and multiple VCDR region instances can forward to a single vRealize Log Insight Cloud instance). In the VCDR UI from the left navigation click Settings and then click the button ARIA OPERATIONS FOR LOGS. Paste the URL & key from step 2 and select event forwarding from now or from a point in the past.
![]()

* VMware Aria Operations for Logs offers an initial 30 day Trial Subscription after which it switches to a Free Subscription that covers 1GB/day log ingest – you are unlikely to get near those limits for VMware Cloud DR log ingest but if you do then warning messages are sent on reaching 75 and 100% of daily consumption. Exceeding the daily threshold without a premium subscription just pauses consumption until the next daily period starts – full details available here.

Exploring the VCDR Data Feed
From Left hand menu select Explore Logs, add a filter for appname contains vmware-cloud-disaster-recovery, select a time period and the events in graphical and text form will be shown underneath.
Expand stream entries to see the other fields you can filter and build logic around for alerts and queries.
Expanding events shows the various fields reported that can be used to further filter or be used to build dashboard elements.
You can also use Live Tail from this view or from the left hand menu to see logged event summaries as they arrive.

Create Queries, Alerts & Trigger Emails
Creating queries and alerts is simplest from the Explore Logs view described above. Simply add filters to build your desired query or alert & give it a meaningful title. For queries you can adjust the chart chart style to suit the query & purpose – grouping by time series is an appropriate default but sometimes grouping by other fields such as count of fields is required (see login example below). Once happy then use the favourites (save query & add to favourites), save query or create alert buttons top right, alternatively just add the query directly to dashboard from the additional options.
For alerts this will take you to a 2nd screen to specify the trigger conditions - time period and count of events (or other metric) and email or other notification, specify any other alert customisation and save.
Below is an example to alert & send emails in case of receiving a critical health event for VCDR.

Create Dashboards
A Dashboard is a convenient 'at a glance' view of multiple queries or widgets – you can create new, import from a content pack, modify an existing one and rearrange to suit your needs. A single dashboard can display data from multiple log sources so you may build or modify a dashboard to show not just VCDR activity but also include queries against the Recovery SDDC and other infrastructure elements.
Here is an example that tracks some useful activity metrics:

All VCDR logged events
A useful catchall and also a starting point for more specific queries as you can drill down to find an entry you are interested in, establish filtering criteria for that and then save as a new query.Display query as text
appname Contains vmware-cloud-disaster-recovery

VMware Cloud DR – Recovery Point Creation
Tracking rate of new recovery point creation.
If PGs are paused or there are issues with site connectivity or connectors then these metrics will dip below normal levels.Display query as text
All appname Contains vmware-cloud-disaster-recovery
Eventtype Contains SnapStoreProtGrpTakeSnapSuccessEvent

VMware Cloud DR – Recovery Point Expiry
Tracking rate of new recovery point deletion. In steady state recovery point expiry should follow a regular pattern. Changes in PG rules for retention apply for subsequently created snaps and expiry is paused during Recovery Plan tests/executions.
Display query as text
All appname Contains vmware-cloud-disaster-recovery
eventtype Contains SnapStoreProtGrpExpiredDeleteSnapEvent

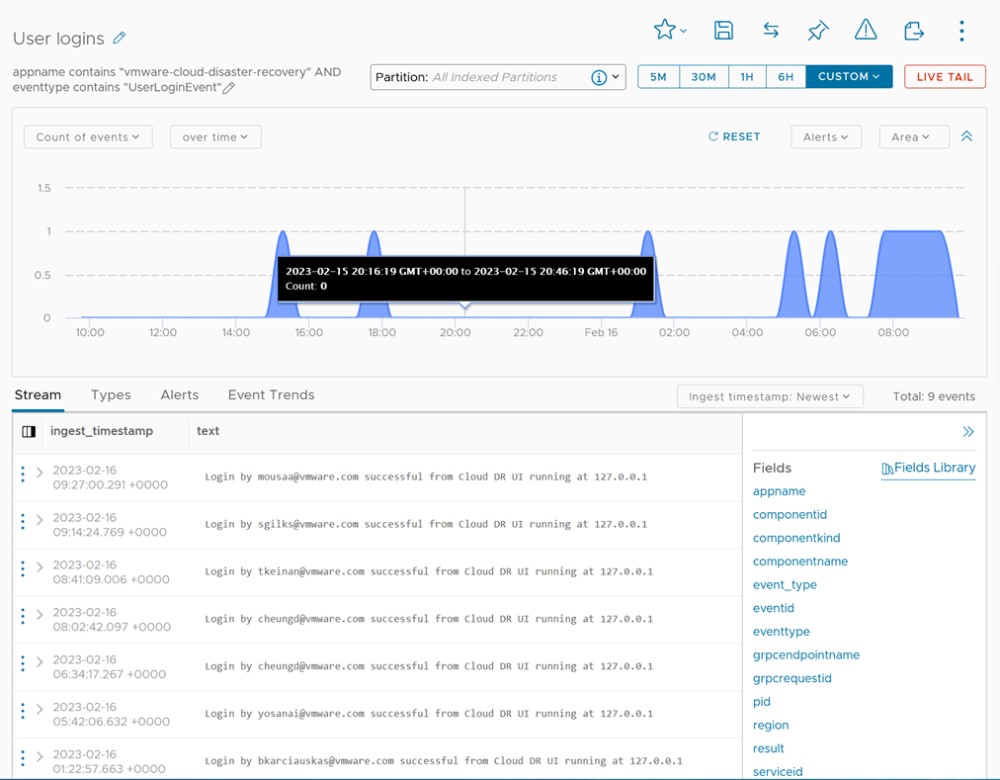
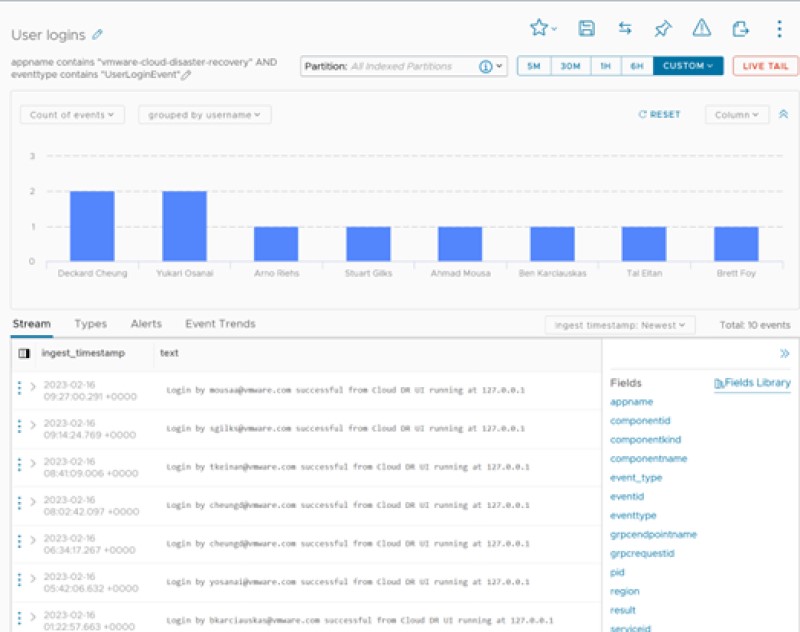
VMware Cloud DR Login Tracking
Displays user logins over the selected period. Because user authentication is handled by the Cloud Services Portal only successful logins are recorded here.
Display query as text
All appname Contains vmware-cloud-disaster-recovery
eventtype Contains userloginevent

VMware Cloud DR – DR Plan Executions
Tracking Recovery plan executions by type (tests and failovers).
Display query as text
All appname Contains vmware-cloud-disaster-recovery
operation Contains start failover start test

VMware Cloud DR – Activity: DR Test
Tracking rate of new recovery point creation. If PGs are paused or there are issues with site connectivity or connectors then these metrics will dip below normal levels
Display query as text
All appname Contains vmware-cloud-disaster-recovery
operation Contains start test

SDDC VMs created
Tracking rate of new VM creations in the recovery SDDC. Other VMC solutions also send logs in and so activity in the Recovery SDDC can be useful to monitor.
The SDDC ID is unique and assigned at SDDC creation time so easiest to set and use where a pilot light / permanent SDDC is used for the recovery environment.
Display query as text
All sddc_id Contains <your-sddc-id-inserted-here>
vmw_vmc_audit_event Contains VmBeingCreatedEvent

VMware Cloud DR - File Restore Operations
Tracking file restore operations. These are selected file and folder restores via an S3 bucket downloaded via browser, this provides access to in-guest data so may be of note from a security perspective
.Display query as text
All appname Contains vmware-cloud-disaster-recovery
operation Contains Restore to archive URL

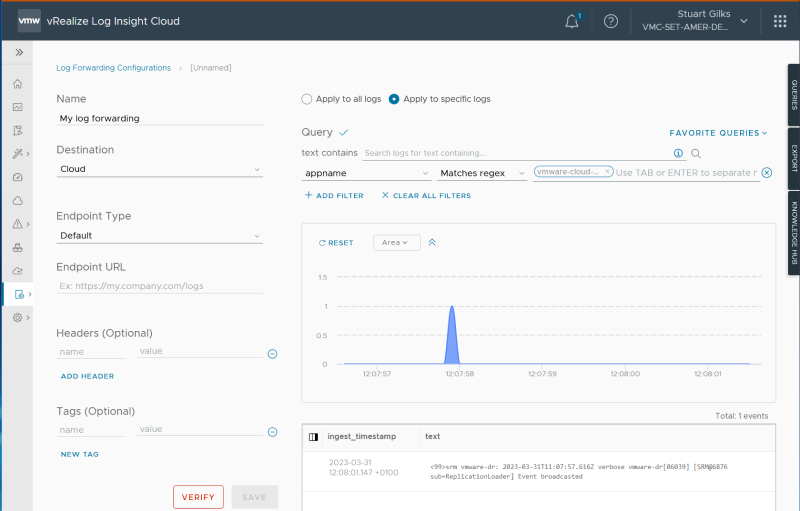
Log Forwarding
You can configure vRealize Log Insight Cloud to forward all or a subset of incoming log events to a syslog or HTTP endpoint such as Splunk or other SIEM to consolidate logging across infrastructure operations.
When you configure log forwarding, you may specify a filter to select which events are forwarded, this can be useful to reduce uneccessary traffic and to reduce processing & storage or ingest costs where there is ingest based metering.
Full documentation is available here - the following example shows forwarding of just VMware Cloud DR events.