
Centralize TKG Logging with vRealize Log Insight Cloud
Logging for Modern Applications
Any application deployed into a production environment needs at least a modest amount of monitoring to ensure that the app is healthy and secure. Capturing event logs is a critical piece of this monitoring stack. Day two operations require comprehensive logging and alerting capabilities for quick response to issues after an application is deployed.
Logging encompasses several different log types to paint a complete picture of what's happening with an application or environment.
- Application Logs – The application itself has essential logs detailing errors or information about how the application behaves. These log messages are usually custom-built with domain-specific knowledge about the application, such as function calls, modules, and context information about what is happening within the application. Developers frequently need access to these logs so that they can improve or troubleshoot their software stack.
- Infrastructure Logs – Underlying infrastructure should also provide log information. Cloud infrastructure is often dynamic, so as scaling events happen, new services get created, old services are removed, etc., logging services record what is happening at the data center level, far below the application. These logs may include hardware events, virtualization events, and possibly operating system events, depending on your environment. Infrastructure logs may be needed to troubleshoot applications, especially if a performance problem has been identified.
- Audit Logs – An audit log provides a trail of events outlining access to a system. If a user or administrator makes a change to the environment, that change should be tracked. This audit trail identifies what changes have been made in an environment so future events might be correlated to this change. Audit logs also provide a mechanism to identify improper access to a system where an unauthorized login creates an alert, presumably to a security team member.
The Need for Centralized Logging
There are many reasons why a centralized store should be used for logging purposes. Traditionally, one of these reasons included log aggregation for event correlation. Think of it this way; if a developer finds errors in the application logs, they might not see the whole picture. The developer might not find out that an infrastructure event is causing the underlying issue because those logs are in a different location. The application and infrastructure logs should be aggregated so that it's easier to identify the real problem that's affecting the application. Additionally, centralized logging provides us with a way to configure alerts which are critical for responding quickly to an outage or security incident. It would be difficult to configure alerts on distributed systems without a central repository.
But specifically, why do we need centralized logging for modern applications? One prominent answer to that question is because we have ephemeral applications that may only live for a few seconds before being stopped or deleted. Traditional applications running on a virtual machine might run and lie dormant until triggered during a future run. During this time, if we needed to check those logs, we could log in to the server and read the log records at any point. But with a modern application, this might live in a container or serverless function, and that container might only live for a few seconds and be deleted. In these cases, it's helpful to be able to read the logs for what happened during the job run even after the resource has been deleted.
Also, modern applications are more distributed than ever. Instead of an application server, you may have a fleet of functions in containers that make up the application stack. If an error occurred within the application, you might need to track down which of the containers made the function call that created the error. A log aggregation solution would let you find this answer much more quickly and serve as a shared resource where multiple teams can read logging data.
vRealize Log Insight Cloud
VMware offers a centralized logging solution called vRealize Log Insight (vRLI). vRLI can be used as an appliance on-premises or, as in this post, as a service through the vRealize Log Insight Cloud service. The vRLI cloud service already has log information from VMware Cloud on AWS environments, so a good part of your infrastructure logs can be reviewed and alerted on without additional configuration just by enabling the SaaS service.
VMware vRealize Log Insight Cloud will ingest real-time logs from the VMware Cloud on AWS service, but we want to push our application logs into vRLI as well to get the full picture of what’s happening in our environment. In this case, we want to add Tanzu Kubernetes Grid clusters to that log repository to centralize logs about our containerized applications.
Configure vRealize Log Insight Cloud
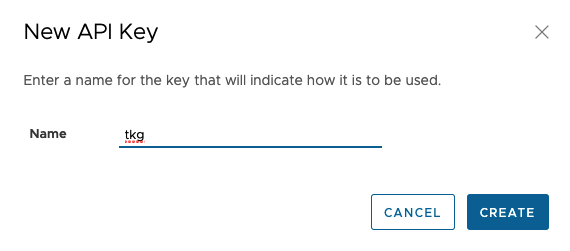
Before you can send logs to vRealize Log Insight Cloud, you need to create an API Key which the log forwarders use to authenticate. To do this, log in to the vRLI Cloud console and go to the configuration settings. Under “API Keys,” click the "New API Key" button and give the new API key a name. I've named mine TKG because these forwarders will be sending logs from my TKG clusters in VMware Cloud on AWS.
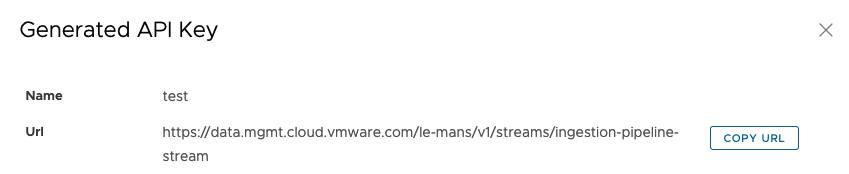
Once you create the new API key, a URL will be presented to you along with the created key; copy these two items down, as you'll need them in the future steps.
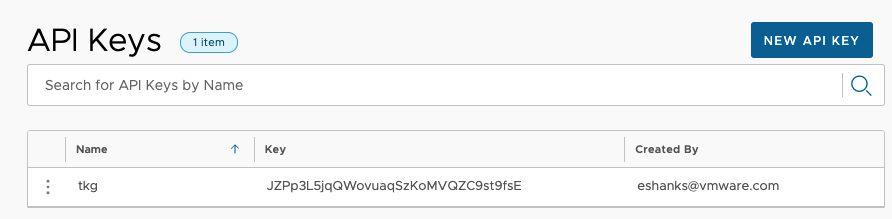
At any point, you can review the list of API keys in case you need to rotate the key or disable access.
Configure TKG Logging Extensions
Once your vRLI instance is ready to go, you are free to deploy your log forwarders and start pushing logs. TKG has a method to deploy Fluent Bit to your TKG clusters to gather the appropriate logs from your cluster, including application logs from containers running within the cluster. The TKG documentation explains this process in full detail.
The process consists of three generalized sections:
- Deploy the Fluent Bit namespace and cluster permissions (cluster roles)
- Create a Kubernetes secret containing the log configuration information
- Deploy Fluent Bit (which will read the secret and use that as its configuration)
The main configuration step (Step 2) is to create a configuration file from an example YAML manifest. The below file would be used with the API key created earlier in this post.
#@data/values
#@overlay/match-child-defaults missing_ok=True
---
logging:
  image:
    repository: projects.registry.vmware.com/tkg
tkg:
  instance_name: "tkg-prod-mgmt"
  cluster_name: "tkg-prod-workload"
fluent_bit:
  output_plugin: "http"
  http:
    host: "data.mgmt.cloud.vmware.com"
    port: "443"
    uri: "/le-mans/v1/streams/ingestion-pipeline-stream"
    format: "json"
    header_key_value: "Authorization Bearer JZPp3L5jqQWovuaqSzKoMVQZC9st9fsE"
The critical configuration pieces are: adding the token to the header_key_value, supplying the URI/host/port, and the TKG instance and cluster information.
NOTE: "instance_name" refers to the management cluster used to create the Tanzu Kubernetes Cluster, and the "cluster_name" field refers to the actual cluster in which it’s being installed.
Once you've applied this configuration to the cluster, logs are sent to vRealize Log Insight cloud.
Configure and Use Dashboards
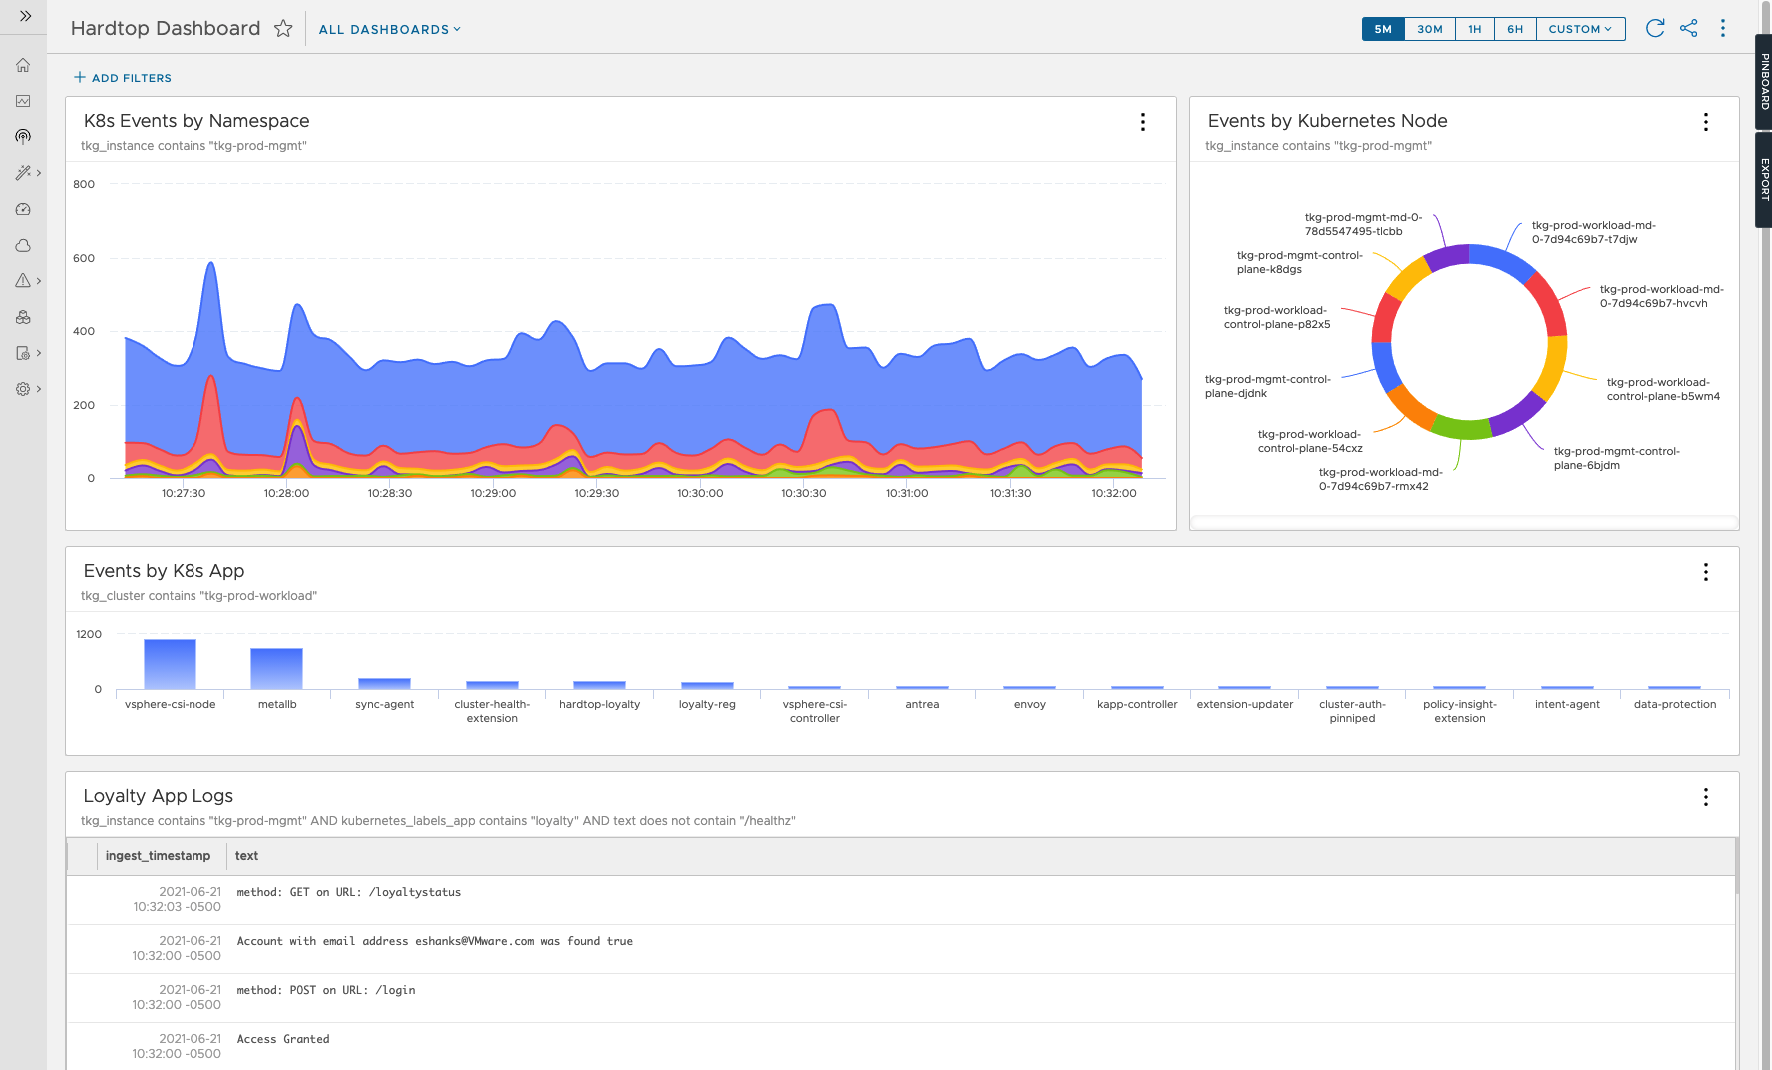
Once logs have been sent to vRLI Cloud, you can start querying those logs for the information critical to your organization. vRLI gives you the ability to set alerts on these log messages as well as build dashboards so that team members can access the events needed to improve the environments or respond to incidents. Below is an example dashboard where we're displaying a summary of the events from our TKG clusters.
Summary and Additional Resources
A centralized log aggregation tool becomes a critical resource for modernized applications due to their distributed nature. vRealize Log Insight Cloud can be quickly configured for VMware Cloud on AWS to get infrastructure logs and TKG extensions for applications logs. Once logs are pushed into vRLI Cloud, alerts, and dashboards can be configured to access information about deployed resources across multiple teams quickly.
Additional Resources
vRealize Log Insight Cloud Documentation
Tanzu Kubernetes Grid Log Forwarding Extension
Changelog
The following updates were made to this guide.
|
Date |
Description of Changes |
|
2021-06-22 |
Initial publication |
About the Author and Contributors
Eric Shanks has spent two decades working with VMware and cloud technologies focusing on hybrid cloud and automation. Eric has obtained some of the industry's highest distinctions, including two VMware Certified Design Expert (VCDX #195) certifications and many others across a variety of solutions including Microsoft, Cisco, and Amazon Web Services.
Eric's acted as a community contributor through work as a Chicago VMUG Users Group leader, blogger at theITHollow.com and Tech Field Day delegate.
- Eric Shanks, Sr. Technical Marketing Architect, Cloud Services Business Unit, VMware